
About Me
Hello, I'm Eric Miller, and I'm a Data Analyst and Economist.I focus on identifying strategic opportunities to enhance company margins and maximize profitability through comprehensive, data-driven analysis.
Skills

Excel | Power BI | Python | RStudio | SQL | Tableau
Data Visualization - 3 years
Business Analytics - 3 years
Report Development - 2+ years
Data Storytelling - 2+ years
Featured Projects
Python | K-Means Dashboard
Using arguably the most widely known form of clustering algorithms from the scikit-learn API, I developed a dashboard that let's you analyze & visualize any clean dataset that you want for results driven data analysis.If you see this message after clicking the link:This app has gone to sleep due to inactivity. Would you like to wake it back up?It's completely fine to click:Yes, get this app back up!

Python | kmflow
A modular command-line interface (CLI) that handles data preparation, exploratory data analysis (EDA), modeling, evaluation, and cluster profiling. Works with large files of data and is perfect for scripting a pipeline.

R | imputeflow
A modular command-line interface (CLI) for missing data imputation using naïve and non-naïve methods, with best-practice support for training masks and automatic train/validation/test splits—designed for pipeline integration and large tabular datasets.

Excel, TypeScript, EViews, & R | A Multi-Equation Forecast Model of the U.S. Vehicle Sales Market
This paper develops a multi-equation forecast model of U.S. light vehicle sales using monthly data from 1976 to 2024, grounded in economic theory and modeling.

Professional Certifications
Exam-based certifications

International Institute of Forecasters Certificate in Forecasting Practice | Issued 2024
Python | K-Means Dashboard
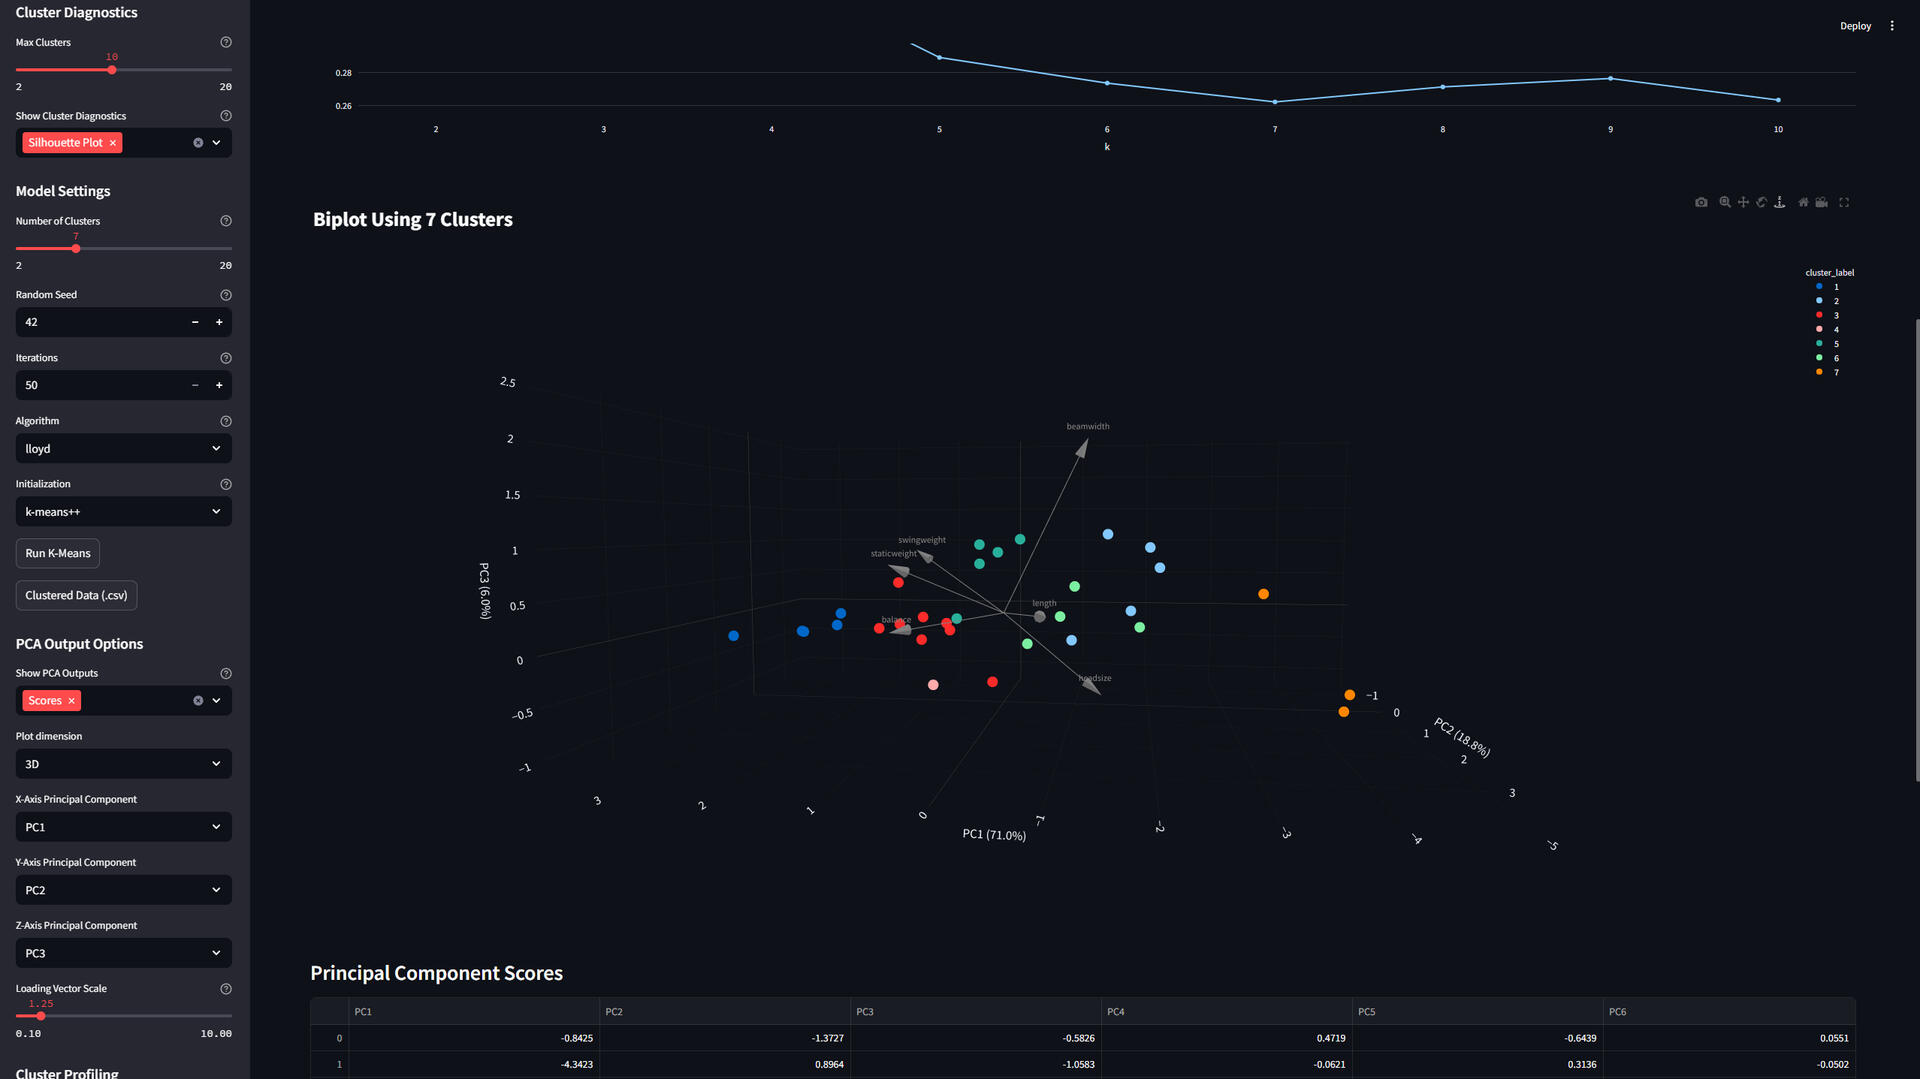
Let’s say your company has data containing only features and no "ground-truth" labels.What does this mean exactly?A good example is a dataset of tennis racquet characteristics. Even without brand or model names, you can still use a clustering algorithm (in this case, K-Means) to identify distinct clusters.Think of clustering as a way to find subgroups in your data. You sort items into groups so that values within each group are similar, while values in different groups are dissimilar.Back to the tennis racquet example:After you run K-Means on the data in the dashboard, you’ll know how to differentiate each cluster for marketing. For instance, one cluster might include racquets with larger-than-average head size and beam width, and lighter-than-average weight. You could define this as beginner-level racquets and tailor your marketing accordingly.The dashboard also includes tools to help you pick the right number of clusters before running K-Means. Choosing the right amount of clusters isn’t purely scientific—clustering is just as much an art as it is a science.If this feels overwhelming, follow the step-by-step instructions right in the dashboard. And if you’re comfortable with using GitHub, you can dive into the detailed documentation on the project page.If you see this message after clicking the link:This app has gone to sleep due to inactivity. Would you like to wake it back up?It's completely fine to click:Yes, get this app back up!
Python | kmflow
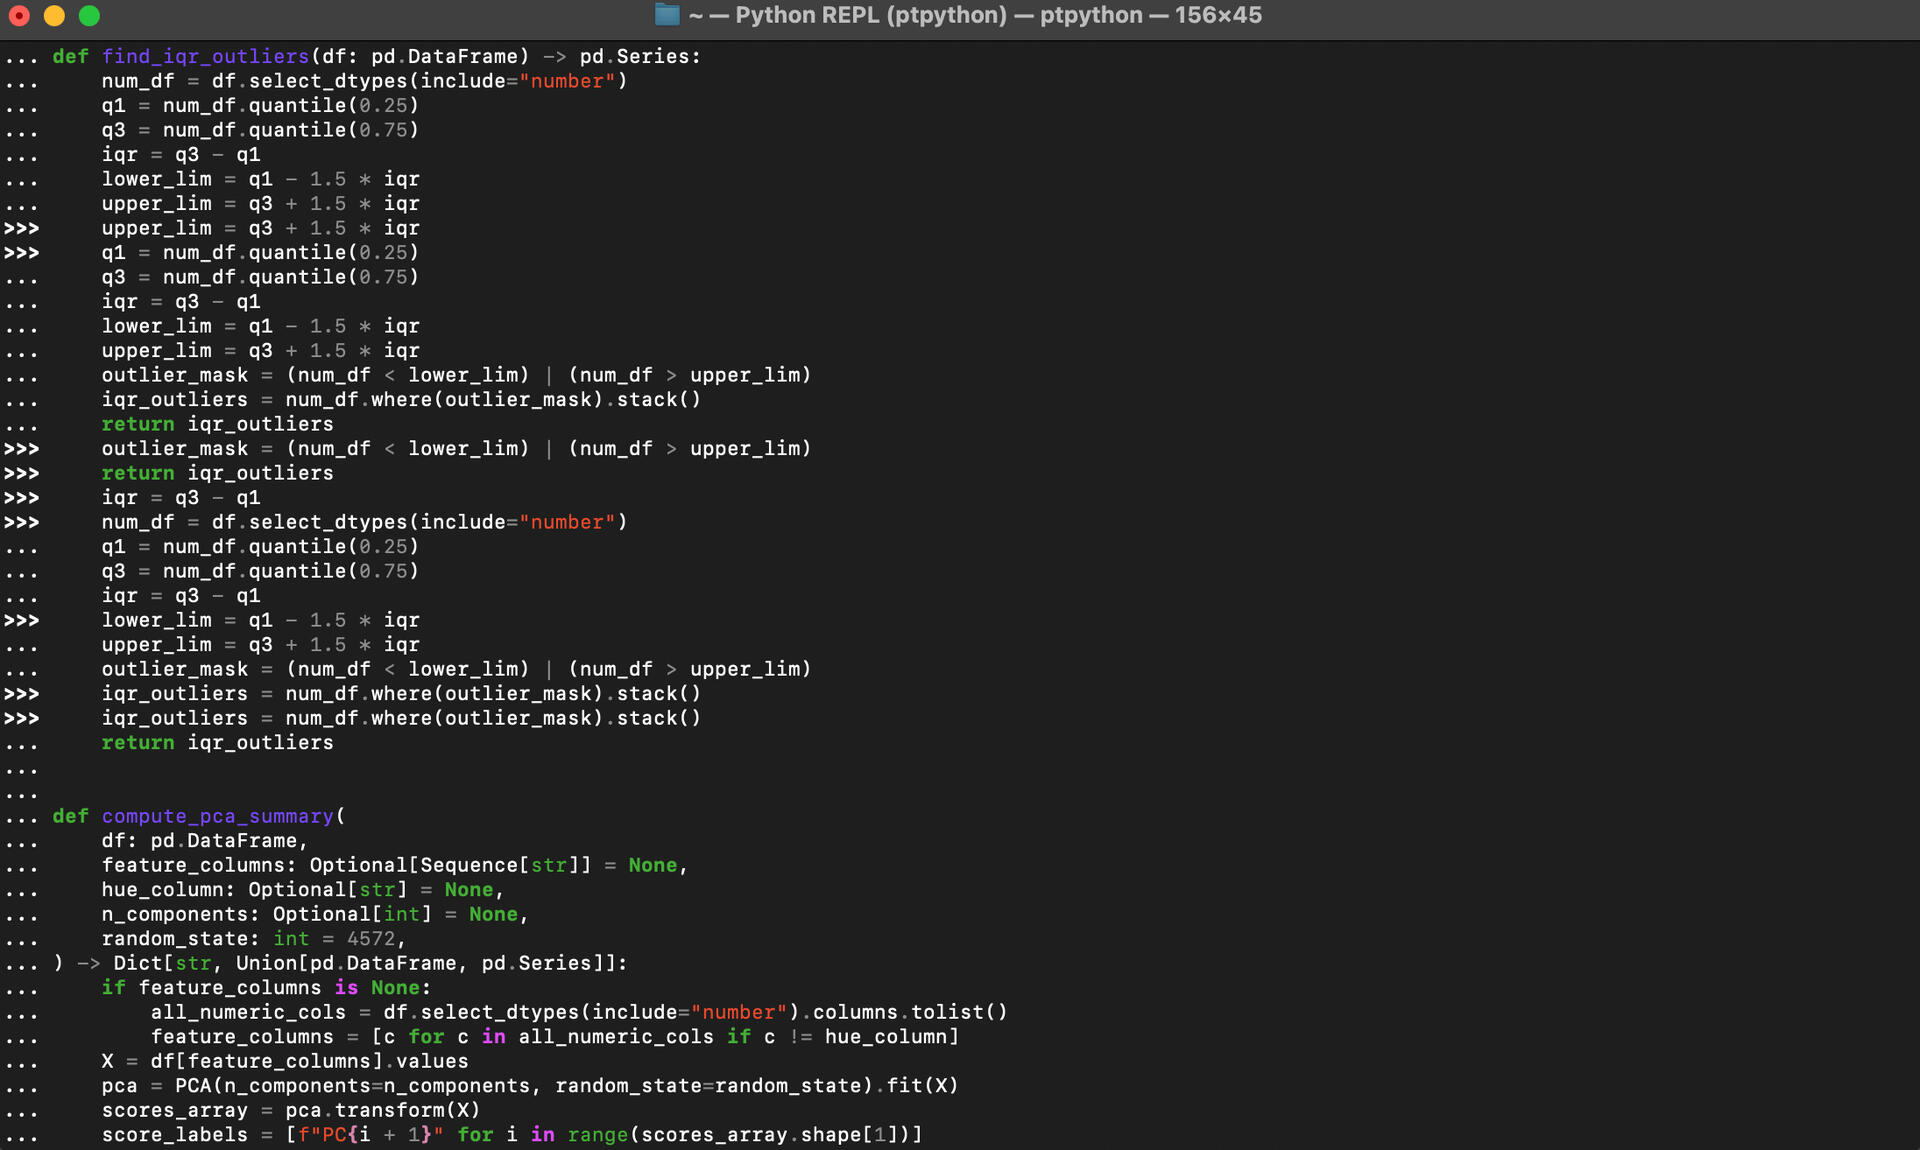
kmflow is a modular command-line interface (CLI) built on top of scikit-learn's KMeans API. You can grab the code on GitHub, where you'll find the utilities for:- Data Processing- Exploratory Data Analysis (EDA)- K-Means Modeling- Evaluation- Profiling ClustersThe CLI even includes a preprocessing utility—though cleaning every possible type of "dirty" dataset is outside this project's scope.Why use the CLI instead of the dashboard?- No 200 MB upload limit: handle much larger files.
R | imputeflow
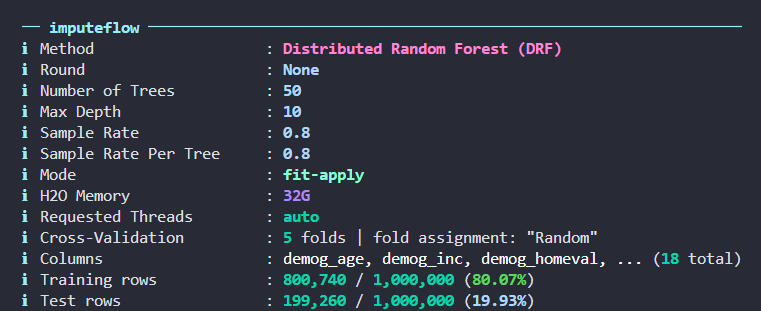
imputeflow is a modular command-line interface (CLI) built on top of R’s recipes and h2o packages. You can grab the code on GitHub, where you'll find utilities for:- Data Imputation (Mean, Median, Mode)
- k-Nearest Neighbors (kNN) Imputation
- Random Forest Imputation via H2O
- Train/Validate/Test Splits (via user-provided mask)
- Progress Bars and TimersThe CLI supports streaming via stdin/stdout—just pipe in your raw CSV and get an imputed version back.
Excel, TypeScript, EViews, & R | A Multi-Equation Forecast Model of the U.S. Vehicle Sales Market
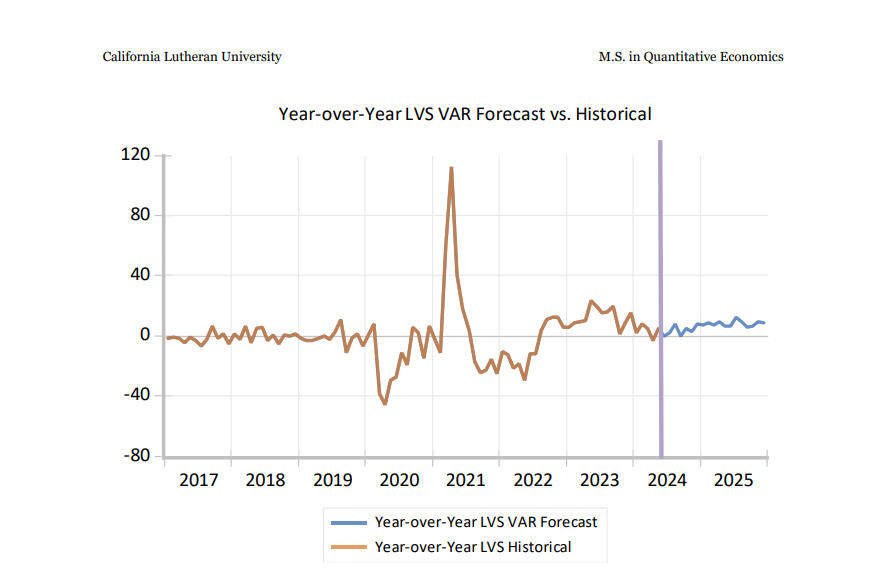
This project is a multi-equation forecasting model built on top of economic theory and monthly U.S. light vehicle sales data (1976–2024).- Structural modeling grounded in demand theory- Forecast evaluation using RMSE, MAPE, and combination strategiesYou can read the full paper below: